Network Visualisation in R
with tags igraph networks network-analysis -Beside the calculation of summarising network metrics, the visualisation of a graph can also be a very informative step in network analysis. Since visualisations in R usually involve the ggplot2 package, I focus on the ggraph package, which is based on the ggplot2 architecture. For illustration I use the artificial data set from my post on network analysis, which is an igraph object names graph_df.
When using ggplot2 the main challenge in the visualisation of networks is to find suitable x- and y-coordinates for the nodes of a graph. Fortunately, there are some packages out there, which were developed for this purpose. For example, ggraph and ggnetwork take an igraph object and produce tables with suitable coordianates. These coordinates are usually obtained by using special algorithms such as the ones proposed by Fruchterman and Reingold (1991) or Kamada and Kawai (1989). The latter is applied in the code below.
ggraph diagrams follow the ggplot2 logic, where the function ggplot is replaced by ggraph to set up the graph. The function is then followed by the layers the user wants to add. In this example we add a layer of edges with geom_edge_link and on top of this a layer of nodes, which are represented by points, using geom_node_point.
# Load packages
library(ggraph)
library(ggplot2)
library(igraph)

ggraph(graph_df, layout = "kk") + # Generate graph
  geom_edge_link(colour = "darkgrey") + # Add a layer of edges
  geom_node_point(size = 3) + # Add a layer of nodes
  theme_graph() # Get rid of gray background colour, grid and axes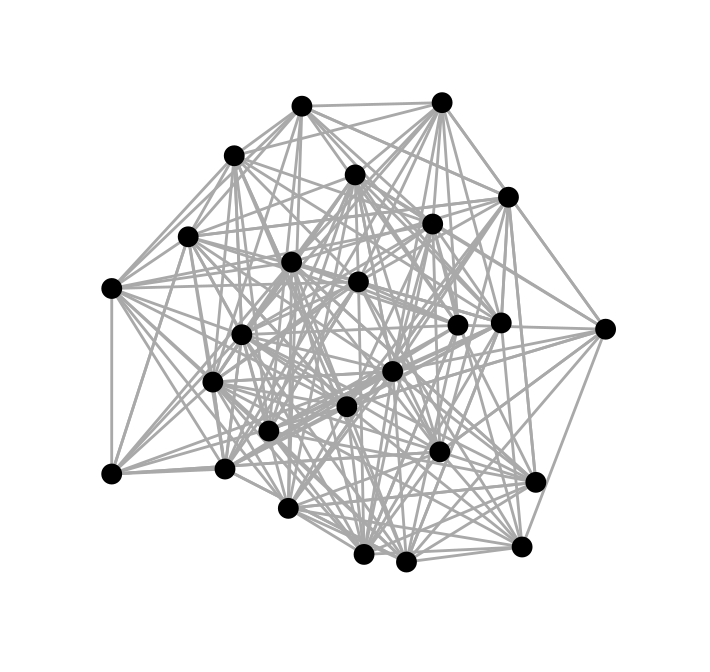
Further introductions to ggraph can be found on https://www.data-imaginist.com/tags/ggraph and in the package’s vignettes, of course.
However, the standard plot function can be used to get a quick impression of a network as well:
plot(graph_df)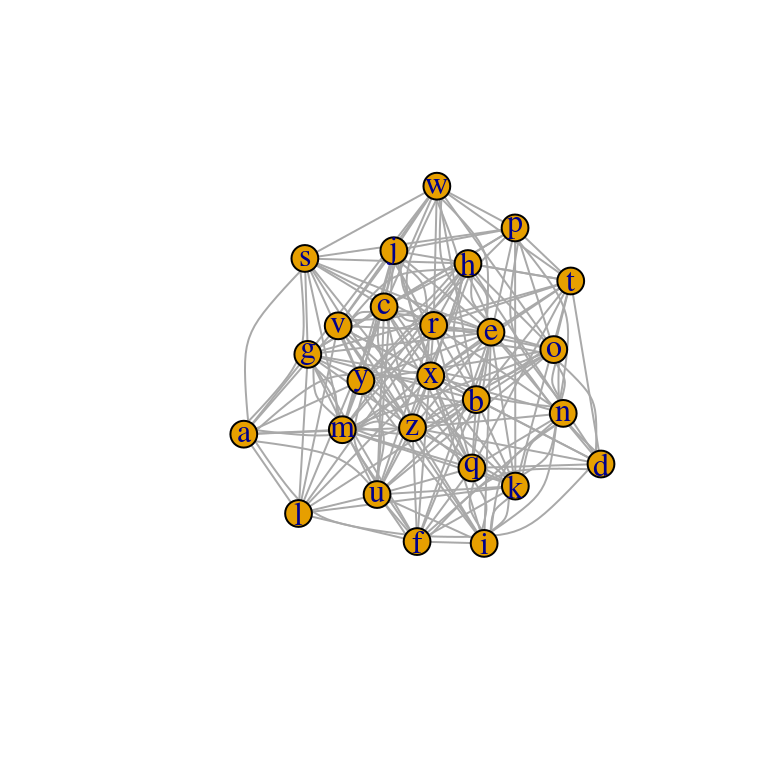
References
Csardi G., & Nepusz, T. (2006). The igraph software package for complex network research, InterJournal Complex Systems, 1695.
Fruchterman, T. M. J., & Reingold, E. M. (1991). Graph Drawing by Force-directed Placement. Software - Practice and Experience, 21(11), 1129-1164.
Kamada, T., & Kawai, S. (1989). An algorithm for drawing general undirected graphs. Information Processing Letters 31(1), 7-15.